ICT Immediate Rebalance Toolkit [LuxAlgo]The ICT Immediate Rebalance Toolkit is a comprehensive suite of tools crafted to aid traders in pinpointing crucial trading zones and patterns within the market.
The ICT Immediate Rebalance, although frequently overlooked, emerges as one of ICT's most influential concepts, particularly when considered within a specific context. The toolkit integrates commonly used price action tools to be utilized in conjunction with the Immediate Rebalance patterns, enriching the capacity to discern context for improved trading decisions.
The ICT Immediate Rebalance Toolkit encompasses the following Price Action components:
ICT Immediate Rebalance
Buyside/Sellside Liquidity
Order Blocks & Breaker Blocks
Liquidity Voids
ICT Macros
🔶 USAGE
🔹 ICT Immediate Rebalance
What is an Immediate Rebalance?
Immediate rebalances, a concept taught by ICT, hold significant importance in decision-making. To comprehend the concept of immediate rebalance, it's essential to grasp the notion of the fair value gap. A fair value gap arises from market inefficiencies or imbalances, whereas an immediate rebalance leaves no gap, no inefficiencies, or no imbalances that the price would need to return to.
Rule of Thumb
After an immediate rebalance, the expectation is for two extension candles to follow; otherwise, the immediate rebalance is considered failed. It's important to highlight that both failed and successful immediate rebalances, when considered within a context, are significant signatures in trading.
Immediate rebalances can occur anywhere and in any timeframe.
🔹 Buyside/Sellside Liquidity
In the context of Inner Circle Trader's teachings, liquidity primarily refers to the presence of stop losses or pending orders, that indicate concentrations of buy or sell orders at specific price levels. Institutional traders, like banks and large financial entities, frequently aim for these liquidity levels or pools to accumulate or distribute their positions.
Buyside liquidity denotes a chart level where short sellers typically position their stops, while Sellside liquidity indicates a level where long-biased traders usually place their stops. These zones often serve as support or resistance levels, presenting potential trading opportunities.
The presentation applied here is the multi-timeframe version of our previously published Buyside-Sellside-Liquidity script.
🔹 Order Blocks & Breaker Blocks
Order Blocks and Breaker Blocks hold significant importance in technical analysis and play a crucial role in shaping market behavior.
Order blocks are fundamental elements of price action analysis used by traders to identify key levels in the market where significant buying or selling activity has occurred. These blocks represent areas on a price chart where institutional traders, banks, or large market participants have placed substantial buy or sell orders, leading to a temporary imbalance in supply and demand.
Breaker blocks, also known as liquidity clusters or pools, complement order blocks by identifying zones where liquidity is concentrated on the price chart. These areas, formed from mitigated order blocks, often act as significant barriers to price movement, potentially leading to price stalls or reversals in the future.
🔹 Liquidity Voids
Liquidity voids are sudden price changes when the price jumps from one level to another. Liquidity voids will appear as a single or a group of candles that are all positioned in the same direction. These candles typically have large real bodies and very short wicks, suggesting very little disagreement between buyers and sellers.
Here is our previously released Liquidity-Voids script.
🔹 ICT Macros
In the context of ICT's teachings, a macro is a small program or set of instructions that unfolds within an algorithm, which influences price movements in the market. These macros operate at specific times and can be related to price runs from one level to another or certain market behaviors during specific time intervals. They help traders anticipate market movements and potential setups during specific time intervals.
Here is our previously released ICT-Macros script.
🔶 SETTINGS
🔹 Immediate Rebalances
Immediate Rebalances: toggles the visibility of the detected immediate rebalance patterns.
Bullish, and Bearish Immediate Rebalances: color customization options.
Wicks 75%, %50, and %25: color customization options of the wick price levels for the detected immediate rebalance.
Ignore Price Gaps: ignores price gaps during calculation.
Confirmation (Bars): specifies the number of bars required to confirm the validation of the detected immediate rebalance.
Immediate Rebalance Icon: allows customization of the size of the icon used to represent the immediate rebalance.
🔹 Buyside/Sellside Liquidity
Buyside/Sellside Liquidity: toggles the visibility of the buy-side/sell-side liquidity levels.
Timeframe: this option is to identify liquidity levels from higher timeframes. If a timeframe lower than the chart's timeframe is selected, calculations will be based on the chart's timeframe.
Detection Length: lookback period used for the detection.
Margin: sets margin/sensitivity for the liquidity levels.
Buyside/Sellside Liquidity Color: color customization option for buy-side/sell-side liquidity levels.
Visible Liquidity Levels: allows customization of the visible buy-side/sell-side liquidity levels.
🔹 Order Blocks & Breaker Blocks
Order Blocks: toggles the visibility of the order blocks.
Breaker Blocks: toggles the visibility of the breaker blocks.
Swing Detection Length: lookback period used for the detection of the swing points used to create order blocks & breaker blocks.
Mitigation Price: allows users to select between the closing price or the wick of the candle.
Use Candle Body in Detection: allows users to use candle bodies as order block areas instead of the full candle range.
Remove Mitigated Order Blocks & Breaker Blocks: toggles the visibility of the mitigated order blocks & breaker blocks.
Order Blocks: Bullish, Bearish Color: color customization option for order blocks.
Breaker Blocks: Bullish, Bearish Color: color customization option for breaker blocks.
Visible Order & Breaker Blocks: allows customization of the visible order & breaker blocks.
Show Order Blocks & Breaker Blocks Labels: toggles the visibility of the order blocks & breaker blocks labels.
🔹 Liquidity Voids
Liquidity Voids: toggles the visibility of the liquidity voids.
Liquidity Voids Width Filter: filtering threshold while detecting liquidity voids.
Ignore Price Gaps: ignores price gaps during calculation.
Remove Mitigated Liquidity Voids: remove mitigated liquidity voids.
Bullish, Bearish, and Mitigated Liquidity Voids: color customization option..
Liquidity Void Labels: toggles the visibility of the liquidity voids labels.
🔹 ICT Macros
London and New York (AM, Launch, and PM): toggles the visibility of specific macros, allowing users to customize macro colors.
Macro Top/Bottom Lines, Extend: toggles the visibility of the macro's pivot high/low lines and allows users to extend the pivot lines.
Macro Mean Line: toggles the visibility of the macro's mean (average) line.
Macro Labels: toggles the visibility of the macro labels, allowing customization of the label size.
🔶 RELATED SCRIPTS
ICT-Killzones-Toolkit
Smart-Money-Concepts
Thanks to our community for recommending this script. For more conceptual scripts and related content, we welcome you to explore by visiting >>> LuxAlgo-Scripts .
Komut dosyalarını "stop loss" için ara

Fourier Adjusted Average True Range [BackQuant]Fourier Adjusted Average True Range
1. Conceptual Foundation and Innovation
The FA-ATR leverages the principles of Fourier analysis to dissect market prices into their constituent cyclical components. By applying Fourier Transform to the price data, the FA-ATR captures the dominant cycles and trends which are often obscured in noisy market data. This integration allows the FA-ATR to adapt its readings based on underlying market dynamics, offering a refined view of volatility that is sensitive to both market direction and momentum.
2. Technical Composition and Calculation
The core of the FA-ATR involves calculating the traditional ATR, which measures market volatility by decomposing the entire range of price movements. The FA-ATR extends this by incorporating a Fourier Transform of price data to assess cyclical patterns over a user-defined period 'N'. This process synthesizes both the magnitude of price changes and their rhythmic occurrences, resulting in a more comprehensive volatility indicator.
Fourier Transform Application: The Fourier series is calculated using price data to identify the fundamental frequency of market movements. This frequency helps in adjusting the ATR to reflect more accurately the current market conditions.
Dynamic Adjustment: The ATR is then adjusted by the magnitude of the dominant cycle from the Fourier analysis, enhancing or reducing the ATR value based on the intensity and phase of market cycles.
3. Features and User Inputs
Customizability: Traders can modify the Fourier period, ATR period, and the multiplication factor to suit different trading styles and market environments.
Visualization : The FA-ATR can be plotted directly on the chart, providing a visual representation of volatility. Additionally, the option to paint candles according to the trend direction enhances the usability and interpretative ease of the indicator.
Confluence with Moving Averages: Optionally, a moving average of the FA-ATR can be displayed, serving as a confluence factor for confirming trends or potential reversals.
4. Practical Applications
The FA-ATR is particularly useful in markets characterized by periodic fluctuations or those that exhibit strong cyclical trends. Traders can utilize this indicator to:
Adjust Stop-Loss Orders: More accurately set stop-loss orders based on a volatility measure that accounts for cyclical market changes.
Trend Confirmation: Use the FA-ATR to confirm trend strength and sustainability, helping to avoid false signals often encountered in volatile markets.
Strategic Entry and Exit: The indicator's responsiveness to changing market dynamics makes it an excellent tool for planning entries and exits in a trend-following or a breakout trading strategy.
5. Advantages and Strategic Value
By integrating Fourier analysis, the FA-ATR provides a volatility measure that is both adaptive and anticipatory, giving traders a forward-looking tool that adjusts to changes before they become apparent through traditional indicators. This anticipatory feature makes it an invaluable asset for traders looking to gain an edge in fast-paced and rapidly changing market conditions.
6. Summary and Usage Tips
The Fourier Adjusted Average True Range is a cutting-edge development in technical analysis, offering traders an enhanced tool for assessing market volatility with increased accuracy and responsiveness. Its ability to adapt to the market's cyclical nature makes it particularly useful for those trading in highly volatile or cyclically influenced markets.
Traders are encouraged to integrate the FA-ATR into their trading systems as a supplementary tool to improve risk management and decision-making accuracy, thereby potentially increasing the effectiveness of their trading strategies.
INDEX:BTCUSD
INDEX:ETHUSD
BINANCE:SOLUSD

Liquidations [ChartPrime]Liquidations Indicator:
The Liquidations indicator is a powerful tool designed to help traders identify significant liquidation levels in financial markets. By analyzing volume data over a specified lookback period, the indicator highlights potential areas where market participants with high leverage positions may face liquidation, providing valuable insights into market dynamics.
Usage:
Traders can use the Liquidations indicator to:
◈ Identify liquidity grab opportunities: Liquidation levels often attract price action as market participants with leveraged positions face the risk of forced liquidation. Traders can anticipate price movements as the market aims to trigger these stops, potentially leading to rapid price movements or reversals.
◈ Confirm trend strength: A cluster of liquidation levels in the same direction as the prevailing trend may confirm the strength of the trend, while divergences between liquidation levels and price movements may signal potential trend reversals.
Settings:
◈ Previous Value Bars Back: Specifies the number of previous bars used in calculating the liquidation levels.
◈ Show Leverage: Allows users to selectively display liquidation levels for different leverage multiples, including 5x, 10x, 25x, 50x, and 100x.
◈ Liquidation Levels Width: Sets the width of the lines representing liquidation levels on the chart.
◈ Short Liquidations Color: Specifies the color of the lines representing short liquidation levels.
◈ Long Liquidations Color: Specifies the color of the lines representing long liquidation levels.
◈ Bar Color: Sets the color of the background bar when the indicator is active.
Visual Representation:
◈ Liquidation levels are plotted as horizontal lines on the chart, with different colors representing short and long liquidation levels.
◈ Each liquidation level is labeled with the corresponding leverage multiple (e.g., 5x, 10x, etc.).
A dashboard displays the active liquidation levels for each leverage multiple, allowing traders to quickly assess the current market conditions.
◈ Time Window allows users to cut off unnecessary part of the chart and concentrate on a current active part of the chart to make better trading decisions:
Interpretation:
Market participants tend to place stop-loss orders near liquidation levels , creating clusters of pending orders. As price approaches these levels, it may trigger a cascade of stop-loss orders, providing liquidity for market orders and potentially leading to rapid price movements in the opposite direction.
Traders can anticipate price reversals or accelerations as price interacts with liquidation levels, using them as reference points for identifying potential entry or exit opportunities.
Note:
While the Liquidations indicator provides valuable insights into market dynamics, traders should use it in conjunction with other technical analysis tools and risk management strategies to make informed trading decisions.

Futures Auto Levels [NariCapitalTrading]Futures Auto Levels Indicator
Introduction
The "Futures Auto Levels" (FAL) indicator shows the previous day's levels, weekly open, high, low, and the Initial Balance Range (IBR).
Indicator Components
The FAL indicator comprises the following components:
Previous Day's Levels: These include the open, high, low, and close of the previous trading day. They are represented on the chart by lines and labels, helping to identify significant price levels from the prior session.
Weekly Open, High, Low: These levels represent the open, high, and low prices of the current trading week.
Initial Balance Range (IBR): The IBR is calculated based on the price range during the first 60 minutes of the trading day. It helps identify initial trading range and potential breakout levels.
How to Use the Indicator
1. Previous Day's Levels:
Monitor the previous day's open, high, low, and close to identify key support and resistance levels.
Use these levels to gauge market sentiment and potential price reversals.
2. Weekly Open, High, Low:
Pay attention to the weekly open, high, and low to understand the market's behavior within the weekly timeframe.
These levels can act as reference points for setting profit targets and stop-loss orders.
3. Initial Balance Range (IBR):
Watch for price movements within the IBR to identify potential trading opportunities.
Breakouts above or below the IBR may signal the beginning of a new trend or continuation of the current trend.
Suggested/Potential Strategies
Reversal Trading: Look for price reversals around previous day's levels, especially when they coincide with other technical indicators or significant support/resistance zones.
Trend Following: Follow the trend by trading breakouts above/below the IBR or weekly high/low levels. Use trailing stops to capture profits while the trend remains intact.
Range Trading: Trade within the IBR when the market is consolidating. Buy near the IBR low and sell near the IBR high, with tight stop-loss orders to manage risk.
Conclusion
The Futures Auto Levels indicator is designed to help incorporate levels into trading analysis and trading strategies to improve profitability and consistency.

Swing Failure Pattern (SFP) [LuxAlgo]The Swing Failure Pattern indicator highlights Swing Failure Patterns (SFP) on the user chart, a pattern occurring during liquidity generation from significant market participants.
A Confirmation level used to confirm a trend reversal is also included. Users can additionally filter out SFP based on a set Volume % Threshold .
🔶 USAGE
Swing failure patterns occur when candle wicks exceed (above/below) a recent swing level but close back below/above it, and occur from more significant market participants engineering liquidity. This pattern can be indicative of a potential trend reversal.
A label and an accentuated wick line highlight the SFP (both can be disabled).
Using a higher "Swings" period will not return different SFP but will however potentially reduce their detection rate.
🔹 Confirmation Level
The confirmation level is the highest point between the previous swing and SFP for a bullish SFP, and the lowest point for a bearish SFP. This level allows confirming a trend reversal after an SFP once the price breaks it.
A small triangle will be displayed when the price closes beyond the confirmation level.
A more reactive and contrarian approach could use the SFP as an entry point, and the confirmation level for taking (partial) profit, or stop loss. The example below shows a possible scenario:
🔹 Volume % Threshold
During the occurrence of an SFP, the Volume % Threshold option allows comparing the cumulative volume outside the Swing level to the total volume of the candle. The following options are included:
Volume outside swing < Threshold: Volume outside the Swing level needs to be lower than x % of total candle volume. Prevent excessive liquidity generation.
Volume outside swing > Threshold: Volume outside the Swing level needs to be higher than x % of total candle volume. Requires more significant liquidity to be generated.
None: No extra filter is applied
Note that in the above case, the left SFP is no longer highlighted because the volume above the swing level was higher than the 25% threshold of the total volume.
When we change the setting to "Volume outside swing > Threshold", we get the reversed situation.
The "Volume outside Swing level" is obtained using intrabar - Lower TimeFrame (LTF) data.
At the intrabar (LTF) level, there are a maximum of 100K bars available. When using the Volume % Threshold filter, a vertical line will highlight the maximum period during which intrabars are available.
🔶 DETAILS
🔹 LTF Settings
When 'Auto' is enabled (Settings, LTF), the LTF will be the nearest possible x times smaller TF than the current TF. When 'Premium' is disabled, the minimum TF will always be 1 minute to ensure TradingView plans lower than Premium don't get an error.
Examples with current Daily TF (when Premium is enabled):
500 : 3-minute LTF
1500 (default): 1-minute LTF
5000: 30 seconds LTF (1 minute if Premium is disabled)
The concerning LTF can be seen at the right-top (default) corner.
🔶 SETTINGS
Swings: Period used for the swing detection, with higher values returning longer-term Swing Levels.
Bullish SFP: enable/disable bullish Swing Failure Patterns.
Bearish SFP: enable/disable bearish Swing Failure Patterns.
🔹 Volume Validation
Validation:
Volume outside swing < Threshold: The volume outside the swing level needs to be lower than x % of the total volume.
Volume outside swing > Threshold: The volume outside the swing level needs to be higher than x % of the total volume.
None: No extra validation is applied.
Volume % Threshold: % of total volume as threshold.
Auto + multiple: Adjusts the initial set LTF
LTF: LTF setting
Premium: Enable when your TradingView plan is Premium or higher
🔹 Dashboard
Show Dashboard: Display applied Lower Timeframe (LTF)
Location: Location of the dashboard
Size: Size of the dashboard
🔹 Style
Swing Lines
Confirmation Lines
Swing Failure Wick
Swing Failure Label
Lines / Labels: Color for lines and labels
SFP Wicks: Color for SFP wick line

Volume Candles By Anil ChawraHow Users Can Make Profit Using This Script:
1. Volume Representation : Each candle on the chart represents a specific time period (e.g., 1 minute, 1 hour, 1 day) and includes information about both price movement and trading volume during that period.
2. Candlestick Anatomy : A volume candle has the same components as a regular candlestick: the body (which represents the opening and closing prices) and the wicks or shadows (which indicate the highest and lowest prices reached during the period).
3. Volume Bars : Instead of just the candlestick itself, volume candles also include a bar or histogram representing the trading volume during that period. The height or length of the volume bar indicates the amount of trading activity.
4. Interpreting Volume : High volume candles typically indicate increased market interest or activity during that period. This could be due to significant buying or selling pressure.
5. Confirmation : Traders often look for confirmation from other technical indicators or price action to validate the significance of a high volume candle. For example, a high volume candle breaking through a key support or resistance level may signal a strong market move.
6. Trend Strength : Volume candles can provide insights into the strength of a trend. A series of high volume candles in the direction of the trend suggests strong momentum, while decreasing volume may indicate weakening momentum or a potential reversal.
7. Volume Patterns : Traders also analyze volume patterns, such as volume spikes or divergences, to identify potential trading opportunities or reversals.
8. Combination with Price Action: Volume analysis is often used in conjunction with price action analysis and other technical indicators to make more informed trading decisions.
9. Confirmation and Validation: It's important to confirm the significance of volume candles with other indicators or price action signals to avoid false signals.
10. Risk Management : As with any trading strategy, proper risk management is crucial when using volume candles to make trading decisions. Set stop-loss orders and adhere to risk management principles to protect your capital.
How the Script Works:
1. Volume Representation : Each candle on the chart represents a specific time period (e.g., 1 minute, 1 hour, 1 day) and includes information about both price movement and trading volume during that period.
2. Candlestick Anatomy : A volume candle has the same components as a regular candlestick: the body (which represents the opening and closing prices) and the wicks or shadows (which indicate the highest and lowest prices reached during the period).
3. Volume Bars : Instead of just the candlestick itself, volume candles also include a bar or histogram representing the trading volume during that period. The height or length of the volume bar indicates the amount of trading activity.
4. Interpreting Volume : High volume candles typically indicate increased market interest or activity during that period. This could be due to significant buying or selling pressure.
5. Confirmation : Traders often look for confirmation from other technical indicators or price action to validate the significance of a high volume candle. For example, a high volume candle breaking through a key support or resistance level may signal a strong market move.
6. Trend Strength : Volume candles can provide insights into the strength of a trend. A series of high volume candles in the direction of the trend suggests strong momentum, while decreasing volume may indicate weakening momentum or a potential reversal.
7. Volume Patterns : Traders also analyze volume patterns, such as volume spikes or divergences, to identify potential trading opportunities or reversals.
8. Combination with Price Action : Volume analysis is often used in conjunction with price action analysis and other technical indicators to make more informed trading decisions.
9. Confirmation and Validation : It's important to confirm the significance of volume candles with other indicators or price action signals to avoid false signals.
10. Risk Management : As with any trading strategy, proper risk management is crucial when using volume candles to make trading decisions. Set stop-loss orders and adhere to risk management principles to protect your capital.
Understanding volume candles can provide valuable insights into market dynamics and help traders make more informed decisions. However, like any technical tool, it's essential to use volume analysis in conjunction with other forms of analysis for comprehensive market assessment.
Understanding volume candles can provide valuable insights into market dynamics and help traders make more informed decisions. However, like any technical tool, it's essential to use volume analysis in conjunction with other forms of analysis for comprehensive market assessment.

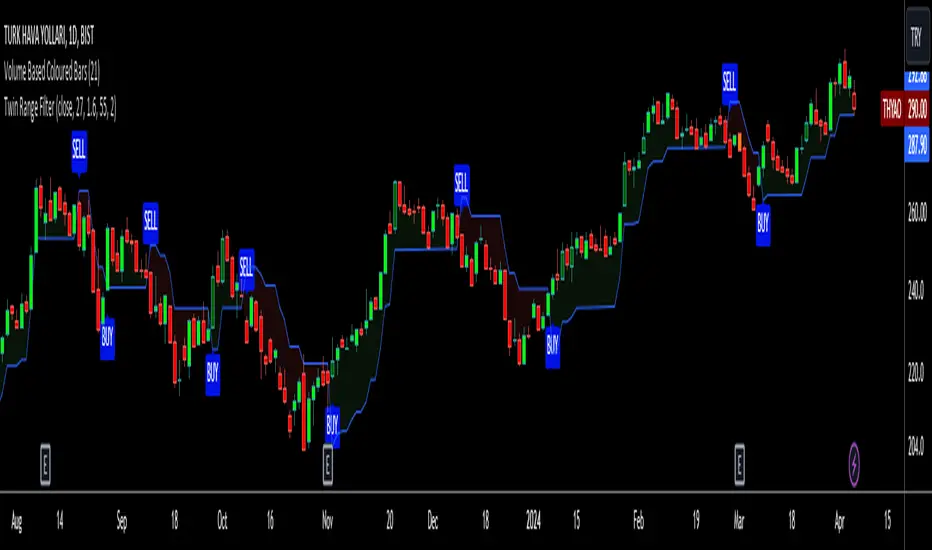
Twin Range Filter VisualizedVisulaized version of @colinmck's Twin Range Filter version on TradingView.
On @colinmck's Twin Range Filter version, you can only see Long and Short signals on the chart.
But in this version of TRF, users can visually see the BUY and SELL signals on the chart with an added line of TRF.
TRF is an average of two smoothed Exponential Moving Averages, fast one has 27 bars of length and the slow one has 55 bars.
The purpose is to obtain two ranges that price fluctuates between (upper and lower range) and have LONG AND SHORT SIGNALS when close price crosses above the upper range and conversely crosses below lower range.
I personally combine the upper and lower ranges on one line to see the long and short signals with my own eyes so,
-BUY when price is higher or equal to the upper range level and the indicator line turns to draw the lower range to follow the price just under the bars as a trailing stop loss indicator like SuperTrend.
-SELL when price is lower or equal to the lower range levelline under the bars and then the indicator line turns to draw the upper range to follow the price just over the bars in that same trailing stop loss logic.
There are also two coefficients that adjusts the trailing line distance levels from the price multiplying the effect of the faster and slower moving averages.
The default values of the multipliers:
Fast range multiplier of Fast Moving Average(27): 1.6
Slow range multiplier of fSlow Moving Average(55): 2
Remember that if you enlarge these multipliers you will enlarge the ranges and have less but lagging signals. Conversely, decreasing the multipliers will have small ranges (line will get closer to the price and more signals will occur)
Trend: SMA with ATR Bands and EMA [Oxyge]Brief introduction:
Easy to use trend indicator to help find entry positions
How it works:
1, short-term trend judgment: EMA is greatly influenced by short-term trends, so it is very good to use it as a tool for judging short-term trends. At the same time, the filtering function has been added:
Long: green
Short: red
No direction: blue
2, the general trend judgment: the use of 30SMA as the default trend line, while increasing the ATR band to increase the scope of judgment.
How do I use (assuming it is now a period of long market):
1, first look at the 30SMA and ATR band, if the slope is positive (> 45 °), then ready to go long!
2. When price comes to the ATR band, the ATR band is my point of interest
3. Wait for a test of the ATR band: the EMA turns green, which means that the short-term trend is already nice and long.
4. Stop Loss Placement: Stop Loss is placed at the most recent low.
Closing
Enjoy it!
——————————————
简单介绍:
简单易用的趋势指标,帮助寻找进场位置
它怎么工作:
1、短期趋势判断:EMA受短期趋势影响很大,因此把它作为判断短期趋势的工具非常好用。同时增加了过滤功能:
多头:绿色
空头:红色
无方向:蓝色
2、大趋势判断:使用30SMA作为默认趋势线,同时增加ATR带增加判断范围。
我是如何使用的(假设是现在是一段多头行情):
1、先看30SMA和ATR带,如果斜率为正(>45°),那么准备做多
2、当价格来到ATR带时,ATR带是我的感兴趣的点
3、等待一次对于ATR带的测试:EMA变成绿色,代表短期已经是不错的多头趋势
4、止损放置:止损放置在最近的低点
结束
请享受它

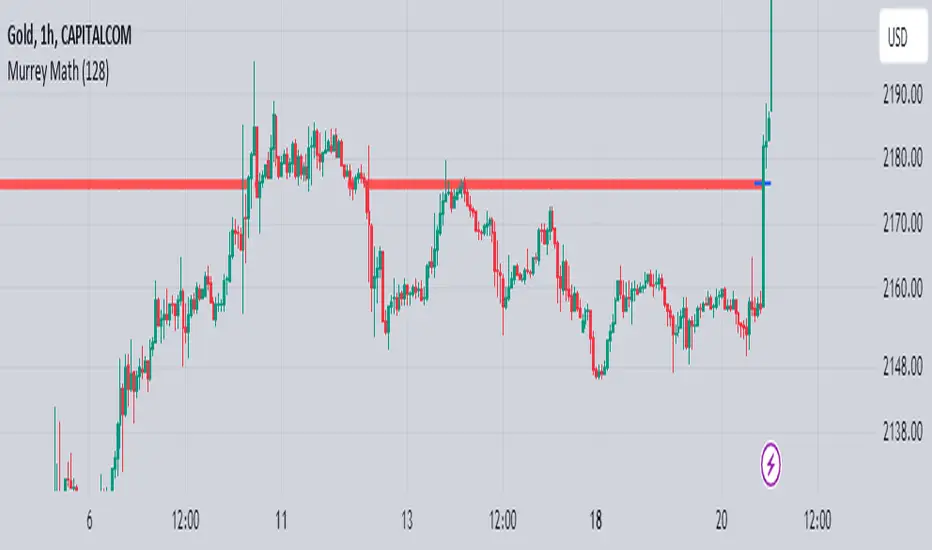
Murrey Math
The Murrey Math indicator is a set of horizontal price levels, calculated from an algorithm developed by stock trader T.J. Murray.
The main concept behind Murrey Math is that prices tend to react and rotate at specific price levels. These levels are calculated by dividing the price range into fixed segments called "ranges", usually using a number of 8, 16, 32, 64, 128 or 256.
Murrey Math levels are calculated as follows:
1. A particular price range is taken, for example, 128.
2. Divide the current price by the range (128 in this example).
3. The result is rounded to the nearest whole number.
4. Multiply that whole number by the original range (128).
This results in the Murrey Math level closest to the current price. More Murrey levels are calculated and drawn by adding and subtracting multiples of the range to the initially calculated level.
Traders use Murrey Math levels as areas of possible support and resistance as it is believed that prices tend to react and pivot at these levels. They are also used to identify price patterns and possible entry and exit points in trading.
The Murrey Math indicator itself simply calculates and draws these horizontal levels on the price chart, allowing traders to easily visualize them and use them in their technical analysis.
HOW TO USE THIS INDICATOR?
To use the Murrey Math indicator effectively, here are some tips:
1. Choose the appropriate Murrey Math range : The Murrey Math range input (128 by default in the provided code) determines the spacing between the levels. Common ranges used are 8, 16, 32, 64, 128, and 256. A smaller range will give you more levels, while a larger range will give you fewer levels. Choose a range that suits the volatility and trading timeframe you're working with.
2. Identify potential support and resistance levels: The horizontal lines drawn by the indicator represent potential support and resistance levels based on the Murrey Math calculation. Prices often react or reverse at these levels, so they can be used to spot areas of interest for entries and exits.
3. Look for price reactions at the levels: Watch for price action like rejections, bounces, or breakouts at the Murrey Math levels. These reactions can signal potential trend continuation or reversal setups.
4. Trail stop-loss orders: You can place stop-loss orders just below/above the nearest Murrey Math level to manage risk if the price moves against your trade.
5. Set targets at future levels: Project potential profit targets by looking at upcoming Murrey Math levels in the direction of the trend.
7. Adjust range as needed: If prices are consistently breaking through levels without reacting, try adjusting the range input to a different value to see if it provides better levels.
In which asset can this indicator perform better?
The Murrey Math indicator can potentially perform well on any liquid financial asset that exhibits some degree of mean-reversion or trading range behavior. However, it may be more suitable for certain asset classes or trading timeframes than others.
Here are some assets and scenarios where the Murrey Math indicator can potentially perform better:
1. Forex Markets: The foreign exchange market is known for its ranging and mean-reverting nature, especially on higher timeframes like the daily or weekly charts. The Murrey Math levels can help identify potential support and resistance levels within these trading ranges.
2. Futures Markets: Futures contracts, such as those for commodities (e.g., crude oil, gold, etc.) or equity indices, often exhibit trading ranges and mean-reversion trends. The Murrey Math indicator can be useful in identifying potential turning points within these ranges.
3. Stocks with Range-bound Behavior: Some stocks, particularly those of large-cap companies, can trade within well-defined ranges for extended periods. The Murrey Math levels can help identify the boundaries of these ranges and potential reversal points.
4. I ntraday Trading: The Murrey Math indicator may be more effective on lower timeframes (e.g., 1-hour, 30-minute, 15-minute) for intraday trading, as prices tend to respect support and resistance levels more closely within shorter time periods.
5. Trending Markets: While the Murrey Math indicator is primarily designed for range-bound markets, it can also be used in trending markets to identify potential pullback or continuation levels.
Sadgir Patterns with SL/TPThe "Sadgir Patterns with SL/TP" is a cutting-edge trading indicator designed for traders seeking to leverage the power of Hull Moving Averages in conjunction with phase accumulation analysis. This unique indicator, developed on the Pine Script platform, is ideal for various markets, including stocks, forex, cryptocurrencies, and commodities.
Key Features:
Adaptive Hull Moving Average: Utilizes an adaptive Hull Moving Average, which provides a smooth and responsive moving average line, aiding in identifying trend directions and potential market reversals.
Phase Accumulation Analysis: Integrates phase accumulation calculations to dynamically adjust the length of the Hull Moving Average, ensuring that the indicator stays in sync with market conditions.
Signal Generation: Generates clear "Long" and "Short" signals, which are visually represented on the chart, assisting traders in making informed decisions.
Dynamic Stop Loss and Take Profit Levels: Automatically calculates and plots dynamic stop loss (SL) and take profit (TP) levels as horizontal lines on the chart, based on user-defined percentage settings. These levels adjust in real-time with the price action, offering a systematic approach to risk management.
Customizable Settings: Provides users with the flexibility to adjust the source of the moving average, power settings for the Hull Moving Average, cycles, and powers for phase accumulation, as well as the percentage values for SL and TP levels.
Visual and Alert Features: Includes options for coloring the bars based on the trend direction and displays trade signals with distinct shapes. Additionally, alert conditions are set for both Long and Short signals, enabling traders to stay informed of potential trade opportunities.
Usage:
This indicator is designed for traders of all levels, from beginners to advanced. It can be used for trend following, catching reversals, or as part of a larger trading strategy. The dynamic SL and TP levels aid in managing trades effectively, providing both entry and exit points. However, traders are advised to use this indicator in conjunction with other analysis tools and consider the overall market context for the best results.
Disclaimer:
Trading involves risk, and it's important to do your own research and consider your risk tolerance before using this indicator. This tool is not intended as financial advice.
NSE:BANKNIFTY
NSE:NIFTY
MCX:CRUDEOIL1!

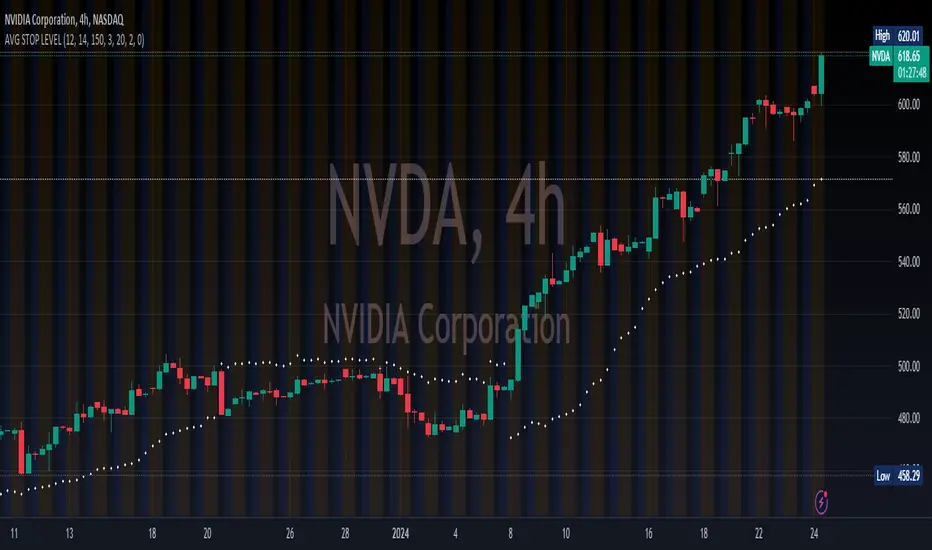
AUTO STOP LEVELThis is a simple yet highly efficient code that calculates stop levels, taking into account the market trend and its volatility.
This script calculates and displays (as a white point in the chart) a stop-loss by considering both volatility and the nearest support/resistance point.
The stop level is determined as the average of three specific values: firstly, two distinct volatility indicators - ATR and Bollinger Bands, and finally, the nearest support/resistance provided by the Supertrend indicator.
Moreover, it analyzes the trend to determine whether the stop should be set for long or short positions, providing insights into the most probable path of future prices. For instance, if the calculated stop level is below the current market prices, it suggests taking long positions, and vice versa.
Customization options include fine-tuning the standard parameters for the three indicators used in averaging and selecting multiple time frames.
PKJ StrategyWelcome to the Daily Price Action Mastery Strategy, a powerful approach to navigating the financial markets using the purest form of market analysis – price action. This trading view strategy is meticulously crafted for those seeking a method that harnesses the daily price movements to make informed and strategic trading decisions.
Key Features:
Daily Candlestick Analysis: Dive into the daily candlestick patterns to identify key support and resistance levels, trend reversals, and potential breakout points. The strategy leverages the valuable information encapsulated in each day's price action to discern market sentiment.
Trend Identification: Utilize trend analysis tools and indicators to pinpoint the prevailing market direction. By understanding the dynamics of daily trends, traders can align their positions with the broader market movement for higher probability trades.
Dynamic Support and Resistance: Implement dynamic support and resistance levels derived from daily price action. These levels act as crucial markers for entry and exit points, helping traders set effective stop-loss and take-profit orders.
Chart Patterns Recognition: Uncover chart patterns such as head and shoulders, flags, and triangles on the daily timeframe. The strategy incorporates pattern recognition techniques to identify potential trend continuation or reversal scenarios, offering traders a comprehensive view of market dynamics.
Volatility Analysis: Gauge market volatility by studying daily price ranges and fluctuations. Volatility indicators are integrated to help traders adjust their risk management strategies in response to varying market conditions.
Confirmation through Indicators: Supplement price action analysis with carefully selected indicators for additional confirmation signals. These indicators are chosen to align with the philosophy of the Daily Price Action Mastery Strategy, enhancing the precision of trade entries and exits.
Risk Management Guidelines: Discover effective risk management practices tailored to the daily timeframe. Learn how to optimize position sizes, set appropriate stop-loss levels, and manage capital to ensure long-term success and sustainability in your trading journey.
Whether you are a seasoned trader or a newcomer to the markets, the Daily Price Action Mastery Strategy provides a comprehensive framework to navigate the complexities of daily price movements. Elevate your trading experience by incorporating this strategy into your analysis, and empower yourself to make well-informed decisions in the dynamic world of finance.

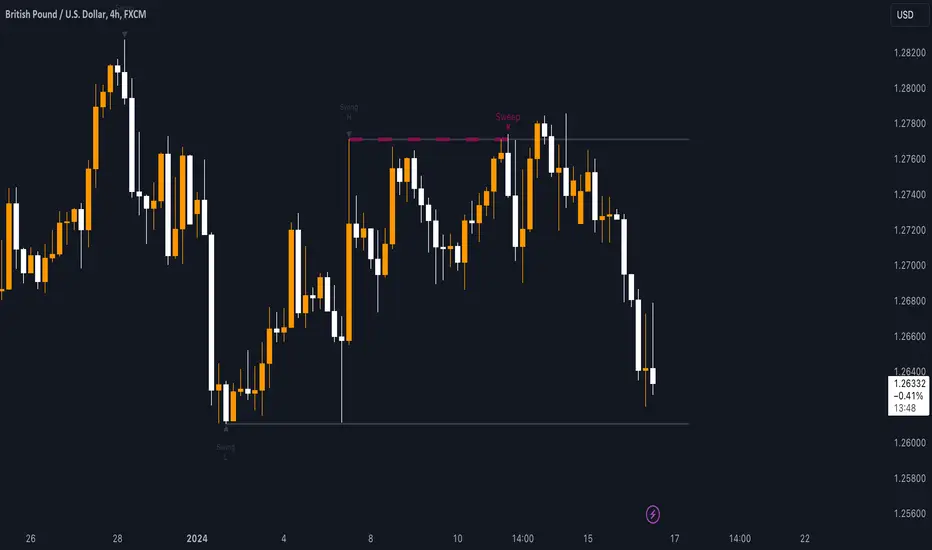
Sweep institutionalThis indicator focuses on identifying "SWEEPs" based on taking liquidity at highs and lows. The application of the SWEEP strategy is highly determinant in the Swing points, as they serve as the target of our operations.
ALERTS INCLUDED
🔹Example of Strategy Application
1.-Create the BULLISH SWEEP.
2.-You can enter LONG.
3.-If it is a BULLISH SWEEP, take a long with a SWING HIGH target (2-3 pips up).
4.-If it is a BULLISH SWEEP, place your SL behind the SWEEP (2-3 pips).
(This example is bullish, but it would be the same in a bearish setup, applying everything in the opposite way)
t's very crucial for the strategy to reference SWING POINTS, as these points will be our take profit and stop loss points.
The strategy is based on identifying a SWEEP. After this, we can look for trading opportunities with targets on the opposite side of the fractal. Remember, if you decide to enter, the Stop Loss should be placed protected by the Sweep, and the Take Profit should be set at the opposite Swing, as seen in the example.
Use this STRATEGY IN TIMEFRAMES GREATER THAN 30M. If you decide to use it in timeframes <30M, there's a higher probability of encountering false SWEEPs (the most optimal are 1h & 4h)
🔹Use
The Sweep strategy involves identifying potential trades based on the creation of a "SWEEP" (liquidity grab) at the Swing High or Swing Low. Below is an example of a bearish opportunity after taking liquidity from a Swing High with a wick and no candle body closing above it.
🔹Details
As you have seen, it indicates the surpassing of a high without the candle body, this is called a “SWEEP.” Each time this occurs, the price is likely to surpass the opposite SWING High/Low. The following example will show more clearly how it works in both bullish and bearish scenarios.
🔹Configuration
-Cooldown period: is the length of the operating Range line
-Swing detection: determines the points to be used as SL and TP protection
Bullish/Berish Sweep
-Line Width: size of the line
-Line Style: design type
-Color
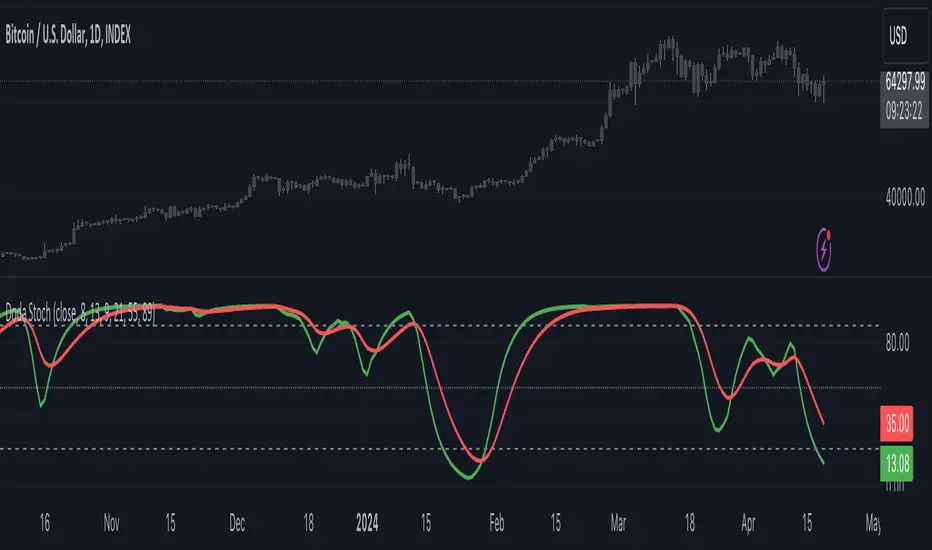
Doda StochasticThe Doda Stochastic Indicator is an oscillator designed to identify primary trends in asset price movements, operating on a scale from 0 to 100. It offers potential buying signals when it fluctuates between 0 and 20, and potential selling signals when it trends between 80 and 100. To reinforce the reliability of these signals, traders often complement them with price action indicators.
The indicator aims to display a modified version of the Stochastic Oscillator, highlighting filtered stochastic values along with related signals.
Traders often use Stochastic indicators to identify potential reversal points or overbought/oversold conditions in the market. The modified version might aim to reduce noise or improve signals compared to the standard Stochastic oscillator. Adjusting the input parameters can alter the sensitivity of the indicator to market movements.
It can also be used to identify trend by considering Doda Stochatic's Moving Average crossing the midline level. If it is above it is uptrend and if below midline then it is downtrend. It does not repaint. It is a lagging indicator because it heavily depends on Moving Averages.
What makes the Doda Stochastic Indicator unique is its attempt to eliminate false or misleading signals commonly found in standard stochastic tools. Instead of relying solely on the 20 and 80 markings for overbought and oversold conditions, it uses the crossing of the green and red lines within these segments to identify signals. However, fully grasping its functionality is pivotal to maximising its utility.
The indicator strategically analyses price movements by scrutinising key price levels, market momentum, and unexpected shifts in trends. By default, it operates with a bar count of 2000 and a PDS value of 13.0, parameters that have undergone extensive testing. It's important to note that tweaking these settings might not always be necessary, as they are well-calibrated.
How to Use the Doda Stochastic Indicator:
Setting up the Indicator:
- Begin incorporating the Doda Stochastic Indicator into your trading strategy once you're confident in identifying significant support and resistance levels.
Strategy with Doda Stochastic:
- Buy Signal Criteria:
- Asset displaying an upward trend.
- Green line crossing above the red line on the indicator.
- Confirm entry with bullish candlestick patterns.
- Set stop loss below the nearest swing low.
- Set take profit at the nearest resistance zone or exit when the green line crosses below the red line.
- Implement risk management with a risk-to-reward ratio of at least 1:2.
- Sell Signal Criteria:
- Asset demonstrating a downtrend.
- Green line crossing below the red line on the indicator.
- Confirm entry with bearish candlestick patterns.
- Set stop loss above the nearest swing high.
- Set take profit at the nearest support zone or exit when the green line crosses above the red line.
- Implement risk management with a risk-to-reward ratio of at least 1:2.
Advantages and Disadvantages:
Pros:
- Analyses crucial price levels, market momentum, and unexpected trend changes.
- Identifies overbought and oversold levels.
Cons:
- Overbought and oversold levels may not always lead to immediate price reversals.
- Signals might occasionally misinterpret a trend reversal as a correction, and vice versa.
The strength of the indicator lies in its intricate approach to price analysis and its effort to minimize false signals. However, traders should exercise caution and consider supplementary confirmation signals for more robust trade decisions.
BreakoutTrendFollowingINFO:
The "BreakoutTrendFollowing" indicator is a comprehensive trading system designed for trend-following in various market environments. It combines multiple technical indicators, including Moving Averages (MA), MACD, and RSI,
along with volume analysis and breakout detection from consolidation, to identify potential entry points in trending markets. This strategy is particularly effective for assets that exhibit strong trends and significant price movements.
Note that using the consolidation filter reduces the amount of entries the strategy detects significantly, and needs to be used if we want to have an increased confidence in the trend via breakout.
However, the strategy can be easily transformed to various only trend-following strategies, by applying different filters and configurations.
The indicator can be used to connect to the Signal input of the TTS (TempalteTradingStrategy) by jason5480 in order to backtest it, thus effectively turning it into a strategy (instructions below in TTS CONNECTIVITY section)
DETAILS:
The strategy's core is built upon several key components:
Moving Average (MA): Used to determine the general trend direction. The strategy checks if the price is above the selected MA type and length.
MACD Filter: Analyzes the relationship between two moving averages to confirm the trend's momentum.
Consolidation Detection: Identifies periods of price consolidation and triggers trades on breakouts from these ranges.
Volume Analysis: Assesses trading volume to confirm the strength and validity of the breakout.
RSI: Used to avoid overbought conditions, ensuring trades are entered in favorable market situations.
Wick filters: make sure there is not a long wick that indicates selling pressure from above
The strategy generates buy signals when several conditions are met concurrently (each one of them can be individually enabled/disabled)"
The price is above the selected MA.
A breakout occurs from a configurable consolidation range.
The MACD line is above the signal line, indicating bullish momentum.
The RSI is below the overbought threshold.
There's an increase in trading volume, confirming the breakout's strength.
Currently the strategy fires SL signals, as the approach is to check for loss of momentum - i.e. crossunder of the MACD line and signal line, but that is to everyone to determine the exit conditions.
The buy and SL signals are set on the chart using green or orange triangles on the below/above the price action.
SETTINGS:
Users can customize various parameters, including MA type and period, MACD settings, consolidation length, and volume increase percentage. The strategy is equipped with alert conditions for both entry (buy signals) and exit (set stop loss) points, facilitating both manual and automated trading.
Each one of the technical indicators, as well as the consilidation range and breakout/wick settings can be configured and enabled/disabled individually.
Please thoroughly review the available settings of the script, but here is an outline of the most important ones:
Use bar wicks (instead of open/close) - the ref_high/low will be taken based on the bar wicks, rather than the open/close when determining the breakout and MA
Enter position only on green candles - additional filters to make sure that we enter only on strong momentum
MA Filter: (enable, source, type, length) - general settings for MA filter to be checked against the stock price (close or upper wick)
MACD Filter: (enable, source, Osc MA type, Signal MA type, Fast MA length, Slow MA length, Low MACD Hist) - detailed settings for fine MACD tuning
Consolidation:
Consolidation Type: we have two different ways of detecting the consolidation, note the types below.
CONSOLIDATION_BASIC - consolidation areas by looking for the pivot point of a trend and counts the number of bars that have not broken the consolidation high/low levels.
CONSOLIDATIO_RANGE_PERCENT - identifies consolidation by comparing the range between the highest and lowest price points over a specified period.
So in summary the CONSOLIDATIO_RANGE_PERCENT uses a percentage-based range to define consolidation, while CONSOLIDATION_BASIC uses a count of bars within a high-low range to establish consolidation.
Thus the former is more focused on the tightness of the price range, whereas the latter emphasizes the duration of the consolidation phase.
The CONSOLIDATIO_RANGE_PERCENT might be more sensitive to recent price movements and suitable for shorter-term analysis, while CONSOLIDATION_BASIC could be better for identifying longer-term consolidation patterns.
Min consolidation length - applicable for CONSOLIDATION_BASIC case, the min number of bars for the price to be in the range to consider consolidation
Consolidation Loopback period - applicable for CONSOLIDATION_BASIC case, the loopback number of bars to look for consolidation
Consolidation Range percent - applicable for CONSOLIDATIO_RANGE_PERCENT, the percent between the high and low in the range to consider consolidation
Plot consolidation - enables plotting of the consolidation (only for debug purposes)
Breakout: (enable, low, high) - the definition of the breakout from the previous consolidation range, the price should be between to determine the breakout as successfull
Upper wick: (enable, percent) - defines the percent of the upper wick compared to the whole candle to allow breakout (if the wick is too big part of the candle we can consider entering the position riskier)
RSI: (enable, length, overbought) - general settings for RSI TA
Volume (enbale, percentage increase, average volume filter en, loopback bars) - percentage of increase of the volume to consider for a breakout. There are two modes - percentage increase compared to the previous bar, or percentage against the average volume for the last loopback bars.
Note that there are many different configuration that you can play with, and I believe this is the strength of the strategy, as it can provide a single solution for different cases and scenarios.
My advice is to try and play with the different options for different markets based on the approach you want to implement and try turning features on/off and tuning them further.
TTS SETTINGS (NEEDED IF USED TO BACKTEST WITH TTS):
The TempalteTradingStrategy is a strategy script developed in Pine by jason5480, which I recommend for quick turn-around of testing different ideas on a proven and tested framework
I cannot give enough credit to the developer for the efforts put in building of the infrastructure, so I advice everyone that wants to use it first to get familiar with the concept and by checking
by checking jason5480's profile www.tradingview.com
The TTS itself is extremely functional and have a lot of properties, so its functionality is beyond the scope of the current script -
Again, I strongly recommend to be thoroughly explored by everyone that plans on using it.
In the nutshell it is a script that can be feed with buy/sell signals from an external indicator script and based on many configuration options it can determine how to execute the trades.
The TTS has many settings that can be applied, so below I will cover only the ones that differ from the default ones, at least according to my testing - do your own research, you may find something even better :)
The current/latest version that I've been using as of writing and testing this script is TTSv48
Settings which differ from the default ones:
Deal Conditions Mode - External (take enter/exit conditions from an external script)
🔌Signal 🛈➡ - BreakoutTrendFollowing: 🔌Signal to TTS (this is the output from the indicator script, according to the TTS convention)
Order Type - STOP (perform stop order)
Distance Method - HHLL (HigherHighLowerLow - in order to set the SL according to the strategy definition from above)
The next are just personal preferences, you can feel free to experiment according to your trading style
Take Profit Targets - 0 (either 100% in or out, no incremental stepping in or out of positions)
Dist Mul|Len Long/Short- 10 (make sure that we don't close on profitable trades by any reason)
Quantity Method - EQUITY (personal backtesting preference is to consider each backtest as a separate portfolio, so determine the position size by 100% of the allocated equity size)
Equity % - 100 (note above)

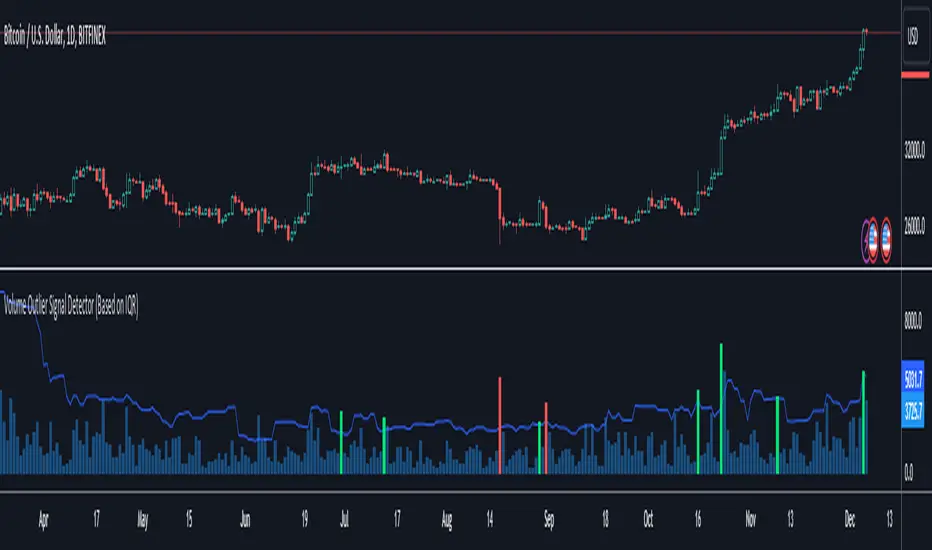
Volume Outlier Signal Detector (Based on IQR)This indicator can detect outliers in trading volume using the 1.5 IQR rule or the outlier formula.
The outlier formula designates outliers based on upper and lower boundaries. Any value that is 1.5 times the Interquartile Range (IQR) greater than the third quartile is designated as an outlier.
The indicator computes the Q3 (75th percentile) and Q1 (25th percentile) of a given volume dataset. The IQR is then calculated by subtracting the Q1 volume from the Q3 volume.
To identify volume outliers, the indicator uses the formula:
Q3 Volume + IQR Multiplier(1.5) * IQR
If the trading volume surpasses the volume outlier, the indicator will display either a green or red column.
A green column indicates that the current bar volume is higher than the volume outlier, and simultaneously, the current bar close is higher than the previous bar's close. Vice versa for the red column.
Moving averages are an optional parameter that can be added to filter out instances where the indicator shows a green or red column. If this option is enabled, the indicator will not display a green column if the price is not above the moving average, and vice versa for red columns.
Several settings can be customized to personalize this indicator, such as setting the moving average filter to higher timeframes. The MA type can also be switched, and IQR settings can be adjusted to fit different markets.
This indicator only works with TradingView charts with volume data.
***Disclaimer:
Before using this indicator for actual trading, make sure to conduct a back test to ensure the strategy is not a losing one in the long run. Apply proper risk management techniques, such as position sizing and using stop loss.